A Study on 3-Point Shooting: Should we change how we contextualize 3-point defense in the NBA?
Can a team truly affect the 3-point percentage of their opponents on defense? Can one season at a time even properly contextualize 3-point shooting? Were the Knicks just “lucky” to achieve the best 3-point defense in the NBA this year? Drew tries to find the answers.

Three-point defense was the subject of much debate with the New York Knicks throughout the season. Was the defense carefully crafted my the masterminds of the Knicks coaching staff, manipulating who specifically can or cannot shoot the ball? Were the NBA Analytics Intelligencia correct all along that the 3-point defense of the Knicks was completely lucky, void of any skill or influence, as shooting 3-pointers is an unexplainable phenomena — like UFOs, or that small little patch of hair that Thibs combs overs like a 1950s greaser? Will we ever get to some sort of consensus, or at the very least try to create some sort of statistical foundation with the data publicly available? This is where I come into the picture.
Back in the mid-2010s, a website you may know as Nylon Calculus, but I know as the website that published an article by yours truly once, had a number of articles dedicated to understanding the nature of the all-so-mysterious 3-point shot. This de-facto series is what much of the three-point discourse is based on, and understandably so given that the research is quite good. But now it’s 2021 and we have much more data to use to have a more comprehensive analysis on the subject. You can never have too much data. Well, actually, you can, but this is not the article nor the website to discuss statistical concepts such as overfitting. Not yet.
Forewarning: This article is going to be quite long and potentially dense. It has a number of different graphs and tables filled with data. I’m going to break the article into sections so everyone can read at their own pace. Or you can plow right through it to see if the conclusions of this article match your preconceived notions on 3-point shooting. It’s entirely up to you. Think of it like a choose your own adventure. Here are how the sections are broken down:
Section One: 3-Point variation
Section Two: Are threes contested?
Section Three: Can opponent 3-point shooting be explained?
Section Four: Knicks talk and conclusions
I recommend reading the article in order, but if you want to be a rebel and read Section Four first and then Section Two, have at it! Don’t let someone on the internet tell you how to read. Who doesn’t love getting lost in a forest and then finding your way to the main path to get to the parking lot so you can get home?
Enough blabbing. Let’s talk basketball statistics.
Section One: 3-point variation
Back in July of 2014, Darryl Blackport wrote one of the foundational articles on 3-point shooting. If you don’t want to read the article, I have the summary for you. After performing a Kuder-Richardson Formula 21 analysis on seven years’ worth of 3-point shooting data from NBA Stats, it was determined that roughly 750 3-point attempts is the minimum threshold for a player’s 3-point shooting percentage to stabilize. I’ll let Darryl explain himself:
If we were trying to get a sense for how stable 3-point percentage is after 100 attempts, a simple way to do it would be to randomly split the 100 shots into two samples of 50 and compare the percentage made in both samples. If it were stable, the percentage of makes in each sample should be similar. A better method would be to split the 100 shots into every permutation of two sample pairs of 50 and calculate the average correlation between the two pairs. This is what the Kuder-Richardson Formula 21 calculates. From here on I will refer to this number as the reliability. To find the point at which 3-point shooting stabilizes we need to find out when the reliability crosses a certain threshold. A reliability of 0.7 seems to be the standard threshold used. After this point, the skill aspect will outweigh the noise. To gather a big enough sample of players with a sufficient number of attempts, I used the past seven seasons’ worth of 3-point shooting data from NBA.com and I found that after roughly 750 attempts the reliability crosses the 0.7 threshold.
This means that after 750 attempts a player’s percentage is split 50-50 between skill and noise. This is still a lot of noise. It is also a lot of attempts.
Unfortunately, I do not have the technical skills to pull from the NBA Stats API and perform Kuder-Richardon analysis on 3-point data. What I can do is provide visual evidence of this concept. Enter our beloved NBA 2020-21 MIP Julius Randle.

The orange line best reflects Blackport’s findings. That’s Randle’s rolling career 3-point percentage, meaning it represents his career shooting percentage at the time. Early in his career, there are a number of peaks and valleys in Randle’s career 3-point shooting percentage. It is not until at least halfway into his career where the line begins to stabilize. The more 3-pointers a player takes in his career, the more stable the percentage will become.
When we say “3-point shooting has a lot of noise and variation,” just take a look at the 10-game moving average blue line. Talk about steep climbs and falls. You can visually see the hot streaks and the cold streaks Randle went on because 3-point shooting in small samples is not stable. When you increase the sample (the green and yellow lines), they smooth out.
One of the more interesting questions about Randle’s 3-point shooting is what will become of it next season. For his career, he is a 34.2% 3-point shooter. In his two seasons with the Knicks, Randle took over 64% of his career 959 3-point attempts, shooting at a 36.1% rate. This season alone, Randle’s 389 3-point attempts were just under 40.6% of his career shots, and he made 41.1% of them.
Now, I doubt Julius Randle is going to shoot over 40% consistently for the rest of his career, but given the notable improvement in both volume and conversion, is it really wild to think that he’s gonna be at worst a 36% shooter from behind the arc? I don’t have the answers, unfortunately. We are going to need another season of Randle taking at least 300-plus attempts to start having a more clear picture of the type of shooter he is. What conclusions we can draw from this is the importance of volume 3-point shooting. Just ask My Prezident.
Section Two: Are threes contested?
In this section, the Nylon article will be referenced again, but provide the source of what we are actually going to talk about. Justin Willard, aka @AcrossTheCourt on Twitter, dove into 2014 SportsVU data to show the closest defender in different shooting zones. The discovery was rather intuitive for anyone who has watched basketball or played basketball. Despite it being intuitive, it is also a foundational aspect of basketball and the data. Shots close to the rim are defended more closely than shots behind the 3-point line. SportsVU, Second Spectrum, and other products like this cost money, so all I get to do is dive into what’s provided by NBA Stats. It still gets the job done.

The historical numbers supports Willard’s finding back in 2014 about 3-point shooting: NBA players are effectively only taking them when there are “open.” In the 2020-21 season, just over 88% of all 3-pointers were taken with a defender at least four feet away from them. That’s a lot of space to get up a shot.
These macro-results are one of the key sources for much of the philosophical discourse about how teams defend 3-point shooting. Are you actually playing “defense” when an overwhelming majority of 3-point attempts are open? This is where the concept of “luck” comes into play. The argument is that if a significant majority of 3-point shots are open, and the league as a whole shoots anywhere between 35-37% on open/wide open threes collectively, should we credit teams or individual players for “holding” their opponents to, say, 33% from behind the arc? Wouldn’t it be more fair to control for this phenomena by having “luck adjustments” to not penalize teams or players for aspects they cannot control for?
Luck-adjusted metrics do have their place in NBA statistics. Not only do they control for 3-point shooting, they control for free throw shooting, a shot that is literally void of any defensive pressure. If the 80% free throw shooter in a game or two happens to shoot 50% on 20 free throws, should a player or a team actually receive credit towards a defensive rating or a defensive impact metric like Defensive RPM? Same goes for the 60% free throw shooter going on a stretch of shooting 100% from the line. Should we penalize the player or team for this small sample that went against the larger aggregate?
I certainly see the argument for these adjustments (primarily free throw adjustments), but there are notable issues that we need to address when we talk about 3-point shooting. Before we even get into the statistical aspect of these issues, let’s discuss using the term “luck.” The word is just flat-out wrong. Using “luck” as a synonym for “variation” or “noise” does a disservice to what is actually occurring on the court. If a player misses an open 3-pointer, the defense isn’t “lucky” that the player missed, because more than 60% of the time on a macro, league-wide scale, the shot is missed. That figure, of course, fluctuates on the players. Steph Curry, for example, this past season shot 44.3% on open and wide open 3-point shots (46.9% on wide open threes), per NBA Stats. So I totally understand when someone is like “the defense was ‘lucky’ that Steph missed the wide-open three” because it’s effectively 50-50 odds when he shoots wide-open threes.
But Steph Curry is one of a kind. Players like Damian Lillard and Buddy Hield are a tier behind Curry when we are discussing the level of stupidity in leaving them wide open. A vast majority of the time, NBA players miss threes, and it is not due to “luck.” As discussed in the first section, 3-pointers vary significantly, needing a very large sample to stabilize. If anything, we should be using the term “variance” instead of “luck” when we discuss 3-pointers. It may sound like a silly, pointless change, but when it comes to statistics and understanding what datasets are saying, we need to use proper terminology so the NBA zeitgeist does not misrepresent what is happening on the court, and also doesn’t misrepresent what the data reflects.
Just because 3-pointers are taken when the player is open, it does not mean that if a player misses — and also makes a shot — we just label that as “luck” or the defense was “lucky” on the possession. Three-point shooting varies, and it does not happen in a vacuum. NBA defenses can actually affect an opponent’s 3-point shooting.
Section Three: Can opponent 3-point shooting be explained?
This is where the true fun begins. Based on the data above, here is what we know:
Three-point shots take a large sample — a minimum of roughly 750 shots — for the shooting percentage to stabilize.
Three-point shooting percentage fluctuates significantly in small samples.
The overwhelming majority of 3-point attempts are taken when the shooter is either open or wide open.
Open 3-point shooting ranges between 33.5% and 35.6%.
Wide-open 3-point shooting ranges between 38% and 39.1%.
So, if these are the macro numbers, how the hell did the New York Knicks’ defense allow 33.7% on 3-point shots? Were the Knicks simply “lucky” as some NBA media members would suggest? It is really because 3-point shooting has so much variation, some teams simply benefit from the distribution of the sample year-over-year? Is everything just random events that no one can do anything about?
Let’s address that last question first, as it will be a perfect segue into the rest of this section. Krishna Narsu wrote about the defended field goal percentage and differential metrics, testing a simple statistical principle: If a metric is capturing a measurable phenomena, there should be a year-over-year correlation at the very minimum. Justin Willard performed a similar analysis with scatter plots on 3-point defense to demonstrate the lack of correlation between opponent 3-point attempts and their respective shooting percentages.
If a player is skilled at defending 3-point shots, his differential should be relatively consistent. Well, spoiler alert to those who plan to read the article, Narsu concluded that there is no statistically significant correlation for defended 3-point attempts or differentials.
(Quick tangent: If you’re asking yourself right now, “How can 3-point shots be both open and defended at the same time?” talk to the statisticians over at NBA Stats.)
Let’s follow the same methodology, but with opponent 3-point percentage:

So each team’s standard deviation of their opponent 3-point percentage is in the far right column, and at the bottom is each season’s year-over-year correlation. The darker the shade of blue, the higher the correlation. There are two ways you can interpret the results here, and both can be true at the same time.
The high variance of 3-point shooting is reflected here as the correlation results are not consistent in any way, suggesting that there is a randomness to opponent 3-point defense in terms of year-over-year projections.
It is worth investigating further the circumstances of the 2015-16 through 2019-20 seasons, as having a correlation result of over 0.4 three of the four seasons does suggest that something may be occurring (Note: correlation results are based in a -1 through 1 scale and the closer you are to those ends, the higher the correlation). Was there less roster and coaching staff turnover during those years, for example? Again, this could very well just be the randomness of the sample given how volatile 3-point shooting is, but it would be better to confirm that conclusion rather than just assume it.
Year-over-year results appear to not be consistently stable, but does that indicate that there is nothing an NBA team can do to influence opponents’ 3-point shooting? There may not be predictive power in opponent 3-point percentage, but can what happened in a specific year be explained? Both Narsu and Willard made important passing comments in their articles that deserve further attention. Here is Narsu from his previously cited article in this section:
The idea of how best to defend a 3-pointer has become pretty solid — don’t let your opponents shoot them. This is not a new concept — we know that there is a lot of randomness in defensive 3-point percentage and that the best defenses generally limit attempts.
Here is Willard from the following article (I told you we would bring this back):
Which component predicts opponent 3-point percentage? The only one that performed well was 2-point percentage, as the others had weak effects and borderline statistical significance. I think this makes sense. If you defend inside the arc well, it’s easier to cover outside shots and you’re probably a good shot defense too.
Let’s explore these two points together. To determine if 2-point defense and limiting 3-point attempts do in fact impact opponent 3-point percentages, I ran a simple linear model of opponent shot location data from Basketball-Reference over a 10-year sample. Before running the regression, I ran correlations on each of the variables to make sure there would be no multicollinearity issues.

There is definitely multicollinearity happening with the % of FGA by Distance 16-3pt and % of FGA by Distance 3pt variables. Both are effectively explaining the inverse of the same phenomena: teams that take more long 2-pointers are decreasing their 3-point attempts. I also removed the Corner 3s variables from the model to make sure that those values do not mess things up, since they are technically covered in the 3-point shot data. Here is the model:

The results of this model are rather straightforward. And since this is not an econometrics class, I do not need to stress over the fact that the t-values for two of the independent variables are not greater/lesser than +2 and -2. Let’s highlight the findings in some quick-and-easy bullet points:
The R-squared value is 0.2757, meaning these collection of shooting metrics for different shooting zones of opponent 2-pointers explain just over 27% of the dependent variable’s (opponent 3-point percentage) variation.
The p-value is less than 0.05, meaning the overall model is statistically signifiant.
I’m going to let Math Is Fun explain what confidence intervals are, because they will do a better job than me. A very simple definition is how confident we can say that the estimate figure of an independent variable will impact the constant/estimate figure of the dependent variable. For example, we can say with just over 85% confidence that when you increase the percentage of opponents’ shots less than three feet from the rim, you will decrease the opponent’s 3-point shooting percentage by 0.05141.
Let me use another example to hammer the previous bullet point home. When you increase the shooting percentage of opponent shots between 10 and 16 feet from the rim, you will increase opponent 3-point percentage by 0.11222 with 99.9% confidence.
The results of the model not only reenforce previously found concepts like “the best 3-point defense is don’t give up a shot and force long twos” (just look at the values for % of FGA by Distance 16-3pt), but also additional context for the impact of different areas on the court. Allowing a high number of shots from 3-16 feet is a great way to minimize an opponent’s 3-point percentage. But the catch is that if your opponent is hyper efficient, or if your defense simply allows for efficient scoring, you’re going to struggle defending the perimeter as well.
But what is a model without the ability to estimate at a reasonable ability. Let’s look at the following scatter plot and whisker graph. The scatter plot shows the relationship between the estimated opponent 3-point percentage and the actual value, while the whisker graph shows each team’s differential of the aforementioned percentages.


In an ideal world, we want the data points to be hugging that trend line, and all within those shaded boxes as close to zero as possible. However, that in no way diminishes the findings, because you can also clearly see that there is a relationship between the estimated value of opponent 3-point percentage and the actual one.
Writing what I’m about to write is strange given that every single one of you are going to say to yourselves, “No shit, Drew,” but how a team defends different areas of the court influences the other areas.
If you are wondering, “Where there can be improvements to this model?” it would be adding different types of data such as: the percentage of defensive possession in zone coverage; the percentage of defensive possessions in drop coverage; percentage of passes received in the shooting pocket; how fast are a player’s closeouts; percentage of shots taken in a player’s “hot zone”; the average wingspan of a team.
Some of these statistics we do have and can compile, but they are not as easy as exporting opponent shooting data from Basketball-Reference. NBA teams certainly have much better tracking data than I can get my hands on, so I would be shocked if teams had not performed similar models like this. This model can certainly be expanded upon, and I definitely encourage folks to do so (if they have the time and means, of course).
Section Four: Knicks talk and conclusions
Time to wrap up this monster of an article by seeing if this all related to the New York Knicks, and what lessons we learned from the research. Much of the discussion to start the season about the Knicks’ 3-point defense was that teams were simply “missing” their shots and that the Knicks were simply “lucky.” We all heard about those pesky luck adjustments.
New York did in fact start the season by giving up more 3-point shots than they did to close out the season, and their opponent 3-point defense did in fact “regress.” With that said, they were still had the best opponent 3-point percentage for the entire 2020-21 season. Was it really all just random sampling? No, it was not.
I took the differentials of the Knicks’ opponent shooting stats from the first 15 games of the season and the last 15 games of the season to see if there were any improvements and if the model works in a more conceptual way. The table below is based on NBA Stats opponent data, as it is easier to segment the data based on games.
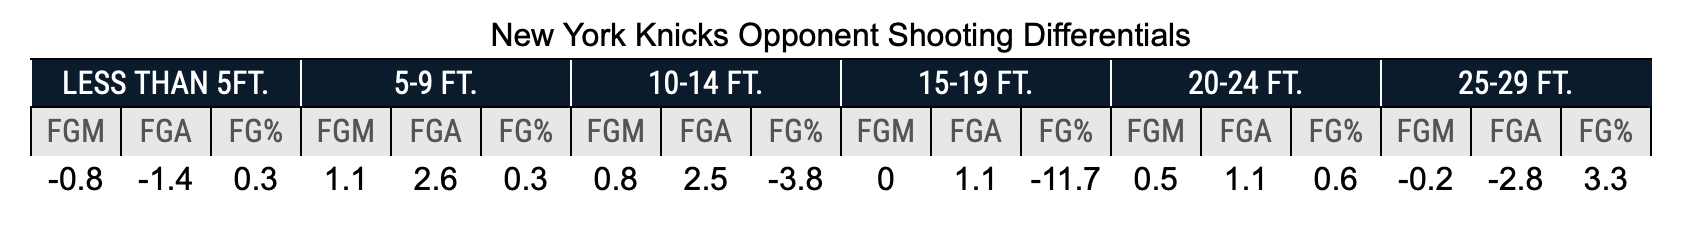
Despite decreasing the number of shots at the rim to close out the season, you see that the Knicks increased their shot attempts in the short midrange areas and decreased their (longer) 3-point attempts. Yes, the Knicks’ 3-point percentage allowed did increase as the year went on, but the overall defense remained elite because they were consistently an elite team defending the rim (third best, per Basketball Reference), increased their opponents’ short-ish midrange attempts (while also defending them at a much better rate), and decreased the number of 3-point attempts.
Does this mean that the Knicks’ 3-point defense was completely void of any “luck?” No, because remember, we need to stop using the term “luck” or to explain 3-point shooting. The Knicks certainly did benefit from the variance inherent in 3-point shooting. That does not, and I repeat, does not mean that we should simply reduce the team’s defensive success to randomness in the sample. What happens on the court defensively is all connected. How teams defend other areas of the court does impact 3-point shooting. If you are a team like the Knicks with an elite rim protector, you’re more inclined to run shooters off the 3-point line to take a closer shot.
If anything, the main takeaway from this article should be “don’t be reductive” when talking about 3-point defense. It’s way more than random sampling. We knew this before, but it bears repeating.