A study on defensive play type data
What does defensive play type data tell us? Does it measure defense effectively in the NBA? Drew looks to answer these questions and maybe find a better way of doing things.

Have you ever started researching a topic, having an idea of how it may turn out, only to have the results be something you did not consider whatsoever? Well, you’re about to experience what I went through over the past few weeks. And what makes all of this quite entertaining is that when we get to the end, you’re going to be like, “Of course these were going to be the results.”
Let’s start from the beginning. Trying to measure individual defense is truly the white whale of basketball analytics. You’re attempting to measure a phenomena where the absence of data is critical to understanding it. Here is a video to help explain what I mean:
What is registered in the stat sheet is a missed field goal by Kevin Knox, but what happens is more than just a missed shot attempt. RJ Barrett drops the bounce pass because he draws Aleksej Pokuševski away from his man, Knox. Pokuševski recovers, though, closing out on Knox to prevent him from taking an open 3-point shot. To counter, Knox puts the ball on the floor, but Pokuševski moves his feet well and is in good position to stop the drive. This results in a contested, step-back, foot-on-the-line 2-pointer that bricks.
If you’re thinking to yourself, “Drew, that’s bad offense and bad shot selection,” I won’t argue with you. Knox’s shot is straight butt juice. With that said, Pokuševski plays fundamentally sound defense and does not get any significant statistical credit for it. This is what I mean by “an absence of data.” Publicly available statistics do not document this play for Pokuševski — something that would might be along the lines of “prevented 3-point shot attempt” and/or “prevented drive to the rim.” On NBA Stats or PBP Stats, he more than likely will get either a “defended shot” or a “contested shot,” but those metrics do not capture the entirety of the play. Plus, we still need more information on what to do on contested made shots, but that’s another subject for another time. The “prevented” form of data collection would be much more useful compared to what is available now, but let me step down from my soapbox and get back on subject.
Outside of counting metrics such as steals, blocks, and defensive rebounds (considering this a part of individual defense is its own debate, but that’s for another time), the “advanced” metrics available to the public to measure individual defense are matchup data and play type data via NBA Stats. We do have different variations of adjusted defensive plus-minus statistics — Defensive RPM, Defensive RAPTOR, Defensive LEBRON, etc. — but these metrics are capturing overall defensive impact of a player with box score priors to, in most cases, create an estimate of Defensive RAPM (DRAPM) because RAPM expects each NBA player to be “league average” from the onset.
Since different adjusted plus-minus metrics have different box score priors, I wanted to see what an estimated version of DRAPM based on play type data would look like.
Does play type defensive data do a good job estimating the value of DRAPM? Answering that question was the intended goal. Luckily for all of us, we did get an answer, but we also discovered much more in the process leading up to it.
If you are not familiar with play type data, you can find it on NBA Stats. It is data from Synergy over a six-year span (2015-16 through 2020-21), detailing offensive and defensive scoring efficiency and other frequencies for the following:
Transition
Isolation
Pick-and-Roll Ball Handler
Pick-and-Roll Roll Man
Post-Up
Spot-Up
Hand-Off
Cut
Off-Screen
Put-Backs
Miscellaneous
Transition, cut, put-backs, and misc. do not have defensive data. Maybe it’s available on the actual Synergy website? Who knows.
Anywell, as I do for the majority of my detailed analyses on NBA phenomena, I decide to prep data to run a good ol’ fashioned linear regression with the trusty RAPM as the dependent variable and the defensive play types as the explanatory variables. But before we can even get to the fun stuff, I need to determine if there is multicollinearity amongst the play type data. I standardized possession and points per possession data (volume and efficiency) and ran a correlation analysis with the data. This is where everything took to wild turn. The points per possession data was not correlated, but the possession data, however…
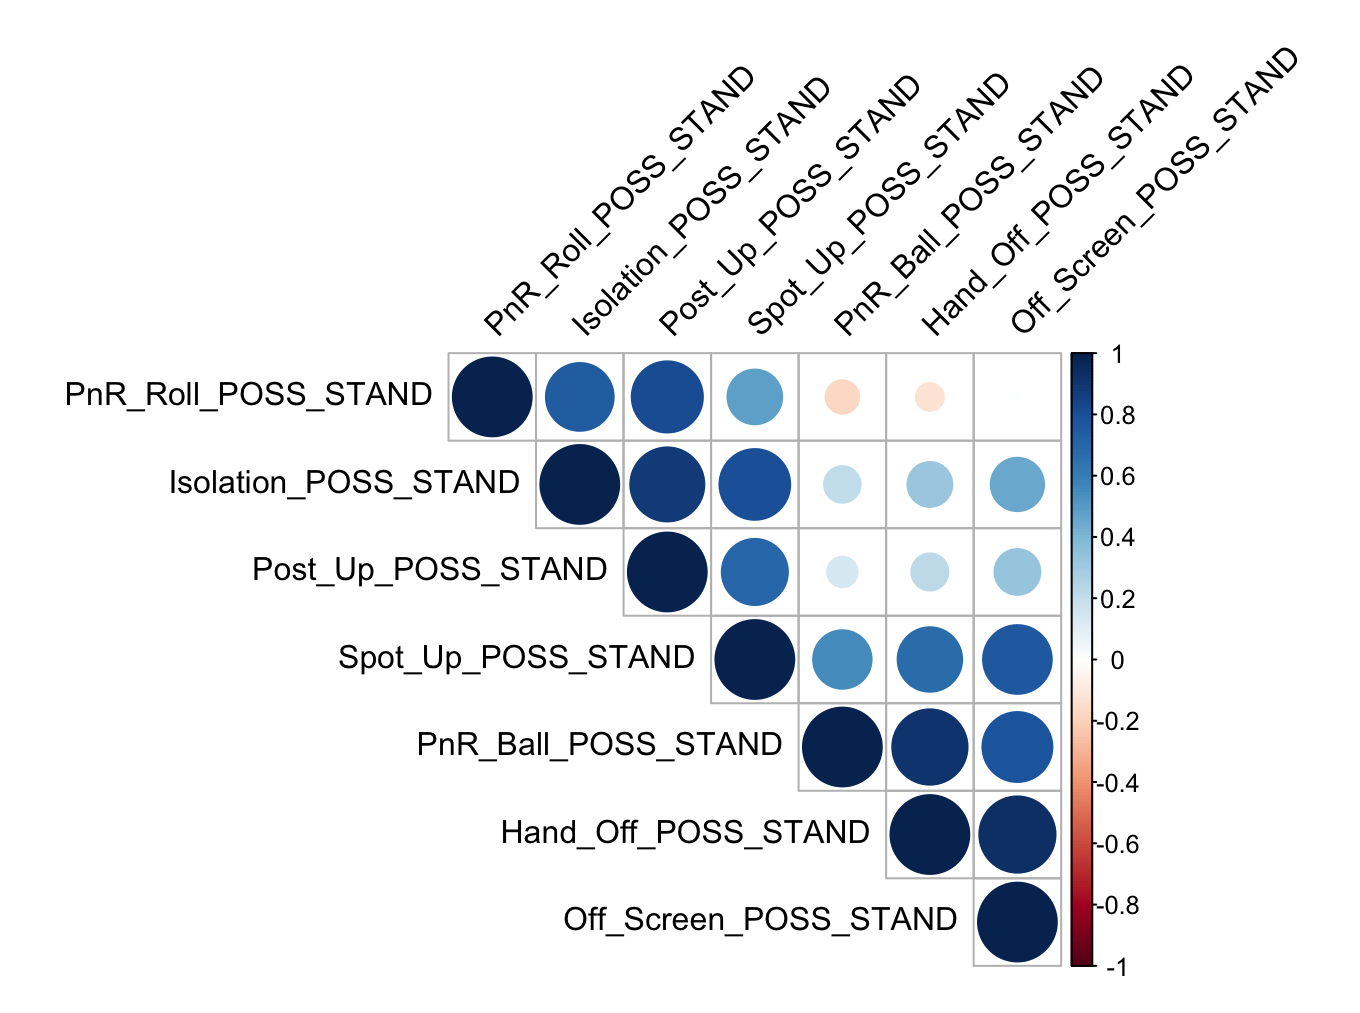
There are a LOT of large, dark blue circles in that matrix. I took out the points per possession fields here to make viewing these results easier. Here are three key conclusions we can extrapolate from these results:
The pick-and-roll roll man, isolation, and post-up defensive possessions are highly correlated with one another.
The pick-and-roll ball handler, hand-off, and off-screen possessions are highly correlated.
The spot-up defensive possessions are highly correlated with all of the other defensive possessions.
Let’s focus on the spot-up results first. A reasonable conclusion you could make from these results is that spot up defensive data is the best predictor of the bunch. Who needs to control for the other types of defensive possessions when this statistical phenomena is captured by one variable?
Though it may seem as if I caught a break, I decided to ask myself a very important question: What type of shots are spot-up attempts? We know that the action itself is when a player sets themself in a specific area of the court, receives a pass, and shoots. Depending on how the statistics are captured, there should not be a time where any made spot-up attempt is unassisted. The next step is to then address an important sub-question: Where are spot up attempts taken? Let’s examine the scatter plot below of some shooting data over the previous three seasons.

As you can see, 3-point shooting and spot-up shooting are highly correlated. Based on the findings in my previously-published “study on 3-point shooting,” we know that an overwhelming majority of 3-pointers are taken when the shooter is open. And if most 3-pointers are taken when they are open, are players on the court actually “defending” spot-up attempts? Does spot-up defense truly matter if most of these attempts are open threes? I think it is safe to say that we should not put much stock into whether or not a player has good or bad spot-up defensive numbers.
Because we are operating under the notion that spot-up shooting defense does not provide much or any value in measuring how impactful a player is on defense, we are still left with a number of questions to address:
Is there anything we can do with these two segments of play type defensive data that is highly correlated?
What would happen if we recategorized the data?
Is there actually another statistical phenomena that these play type defensive actions are actually capturing?
Does redefining play type data have any effect on the variation of Defensive RAPM?
Unfortunately, you good folks will have to wait until next week as I wrap up all the findings and analysis I have on play type defensive data.
That’s right, it’s a…