To win it all in 2026, the Knicks must realize every game is different
Winning may be more fun than fun, but without fluidity there can be neither

Tom Thibodeau is an analytically sound coach.
That both reads and feels weird, right? Yet there’s much truth in that statement. If you haven’t already read this banger on that subject, this is where you pause, click the link, read and return. I’ll wait. Here’s some listening music.
Glad you’re back. When I read that piece, this stood out most:
“The second commandment the front office established — one which remained under-discussed throughout the last five years — is a commitment to analytics-ball. Nobody seems to associate the Knicks with analytics, possibly because Thibs had such a powerful brand that it overwhelmed any other traits which could be associated with the team. We were gritty, physical, competitive, overachieving, high-minutes dawgs — not an org steeped in progressive basketball strategy. Despite that reputation, the evidence of numbers reigning supreme was always there, if you knew where to look.”
This is where “mathketball” and Thibodeau’s philosophies enter into a Venn diagram. When we think of Thibsball, we think: winning the possession battle; minimizing turnovers; taking quality shots. The goals every game are to win and to treat every game equally, whether in January or June.
We can actually model this. Let’s begin by asking: What variables/statistics have the greatest impact on the outcome of a game? I took the game logs for every team from every game over the past five seasons (I think that’s a large enough sample) from the nbastatR package, containing the basic and traditional statistics we see in any box score: field goal percentage, 3-point attempts, turnovers, etc. I then calculated the number of shots missed for 2-point, 3-point, and free throw attempts to use in my two models. I prefer using this method than using either the combination of makes-attempts or attempts-percentage for two reasons.
First, shots made and attempted are highly, highly correlated, which would cause multicollinearity – variables explaining the same phenomena. Second, as I outlined here regarding Jalen Brunson’s defense, allowing a shot attempt is technically “bad” defense, since that means you’ve allowed an opportunity for a basket. Dividing the shot attempt into its binary outcomes allows us to view the rewards and penalties for making and missing shots.
Below is a correlation table of all the variables involved in these models, including the dependent variable of “win”:
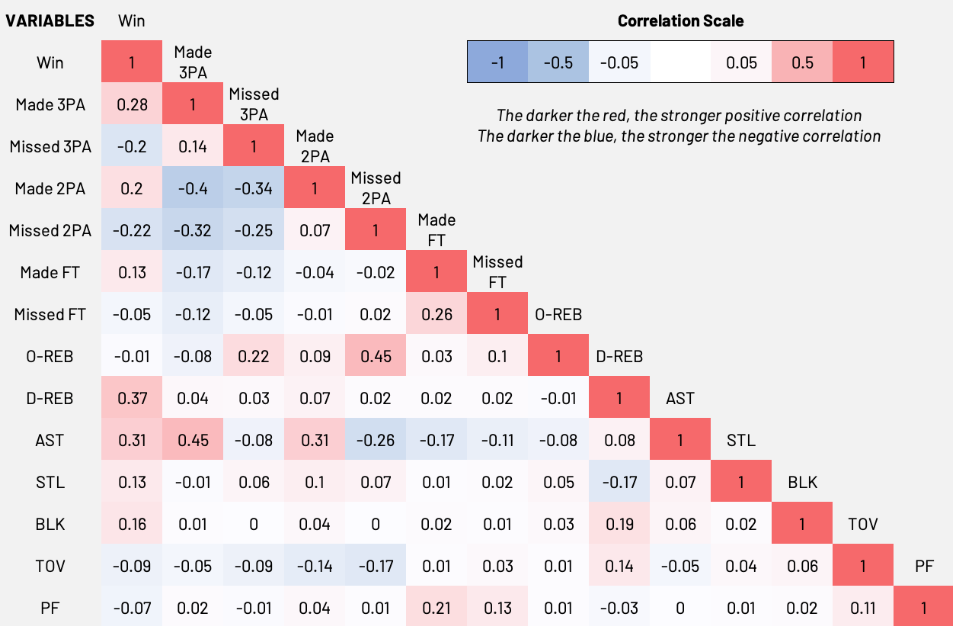
Those are a lot of numbers, so here’s the best way to view this chart: the “win” variable is at the top, with a red box both next to and below it with the number one inside. When correlating two variables, the scale is between +1, an absolute positive correlation between the values, and -1, an absolute negative, with 0 being no correlation. All the values in the “win” variable correlate to themselves absolutely. Makes sense, right?
Now let’s jump to the “missed 3PA” row, where you’ll see a -0.2 value in light blue under the “win” column and a +0.14 value in light red under “made 3PA.” What these tell us is that when you increase the number of 3-point attempts, you are decreasing the amount of wins you have and increasing the amount of made threes. However, because those values are much closer to 0 than +1 or -1, the correlation is weak in each direction.
In an ideal world, you want all of your explanatory variables as close to 0 as possible. Because the variables are all less than either +0.5 or -0.5, I decided to run everything together, especially because these variables describe different phenomena. With that said, as you’ll see, the “assist” variable gets lost in the shuffle because of it being positively correlated to the dependent variable “win” and two explanatory variables, “made 2PA” and “made 3PA.”
Now, the moment you’ve all been waiting for – the results.
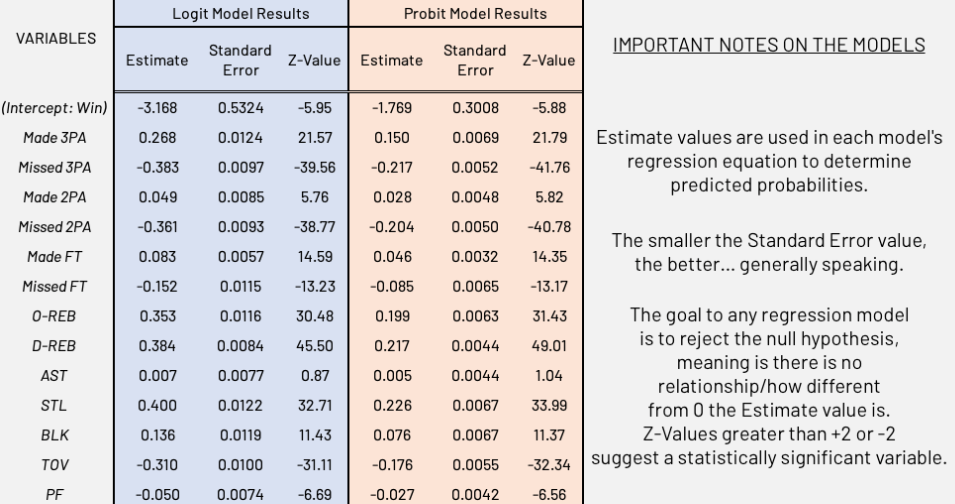
Every single traditional box score stat — besides assists, lost in the multicollinearity with made shots — is statistically significant in influencing the odds of a team winning a game. Both models are also statistically significant, which is a good thing. The tone of this article would be much different if there was no relationship between winning and these variables, either groundbreaking or “I fucked something up,” the latter more likely. There’s a scatter plot at the end of this article showing the relationship between a team’s win total for the season and its estimated win total based on the logit model, but before that we need to talk about the results.
There is actually nothing groundbreaking in the results. If anything, they confirm both conventional wisdom and Thibodeau’s basketball principles: the variables with the highest estimated impact on the predicted probability of winning are steals, missed threes, missed twos, defensive rebounds, offensive rebounds and turnovers. Translation: if a team rebounds on both ends, generates more turnovers than it allows and doesn’t miss shots, they will more than likely win. Mind-blowing, huh? And to think there are people out there who believe analytics and the eye test are diametrically opposed.
Now I have to address the elephant in the room. If the Knicks are an organization of analytics nerds, and the analytics back Thibodeau’s philosophies, why was he fired? When it comes to logit regressions or the points per value on a 3-point shot, statistics used as prediction measurements are not perfect, but simply estimates, best guesses trying to unravel the unknown. It’s not exact.
Sure, the model accurately predicted the win totals for Cleveland this season, and was only one off on Golden State and Oklahoma City. But it also had the Knicks winning 43 instead of 51 and Boston 54 instead of 61. Is there something inherently “wrong” with the model? Or is this the standard error playing its role because there is still unexplained variation not captured in the model?
It’s the latter.
League-average 3-point shooting this season was 36 percent, which means 1.08 points per attempt, equivalent to shooting a league-average 54 percent from two. Obviously just because the average was 36 percent doesn’t mean teams made precisely 36 percent each and every game. There’s a reason variation and standard deviations exist. Sometimes the general consensus doesn’t apply to a specific situation. Sometimes the game calls for something else to happen — like maybe playing your best point-of-attack defender in the Eastern Conference finals against a perimeter-oriented offensive team more than 18 minutes a game. We see you, Deuce.
It’s quite tragic that a coach who at the very least made a lot of noise about “each game is different” and “you must move on from the previous game” rarely behaved that way during the actual games. Thibodeau came off as someone who looked at the numbers and tried to repeat the results over and over and over again, similar to the Celtics playing the points-per-shot on threes over and over and over again, hoping the desired outcome would consistently repeat. That’s not how anyone should be using statistics or interpreting analysis. These are grounded guidelines that you should strive to achieve with the understanding that no two games are ever alike.
You can’t control for everything, whether that’s life or a statistical model. If something isn’t working and is getting in the way of your goal, maybe you have to change things up. That’s what the New York Knicks did. Let’s hope whoever their new coach is understands this.
Addendum
Here is the plot detailing the relationship between a team’s win totals for the season versus what the model projected for that season, based on the explanatory variables (box score statistics).
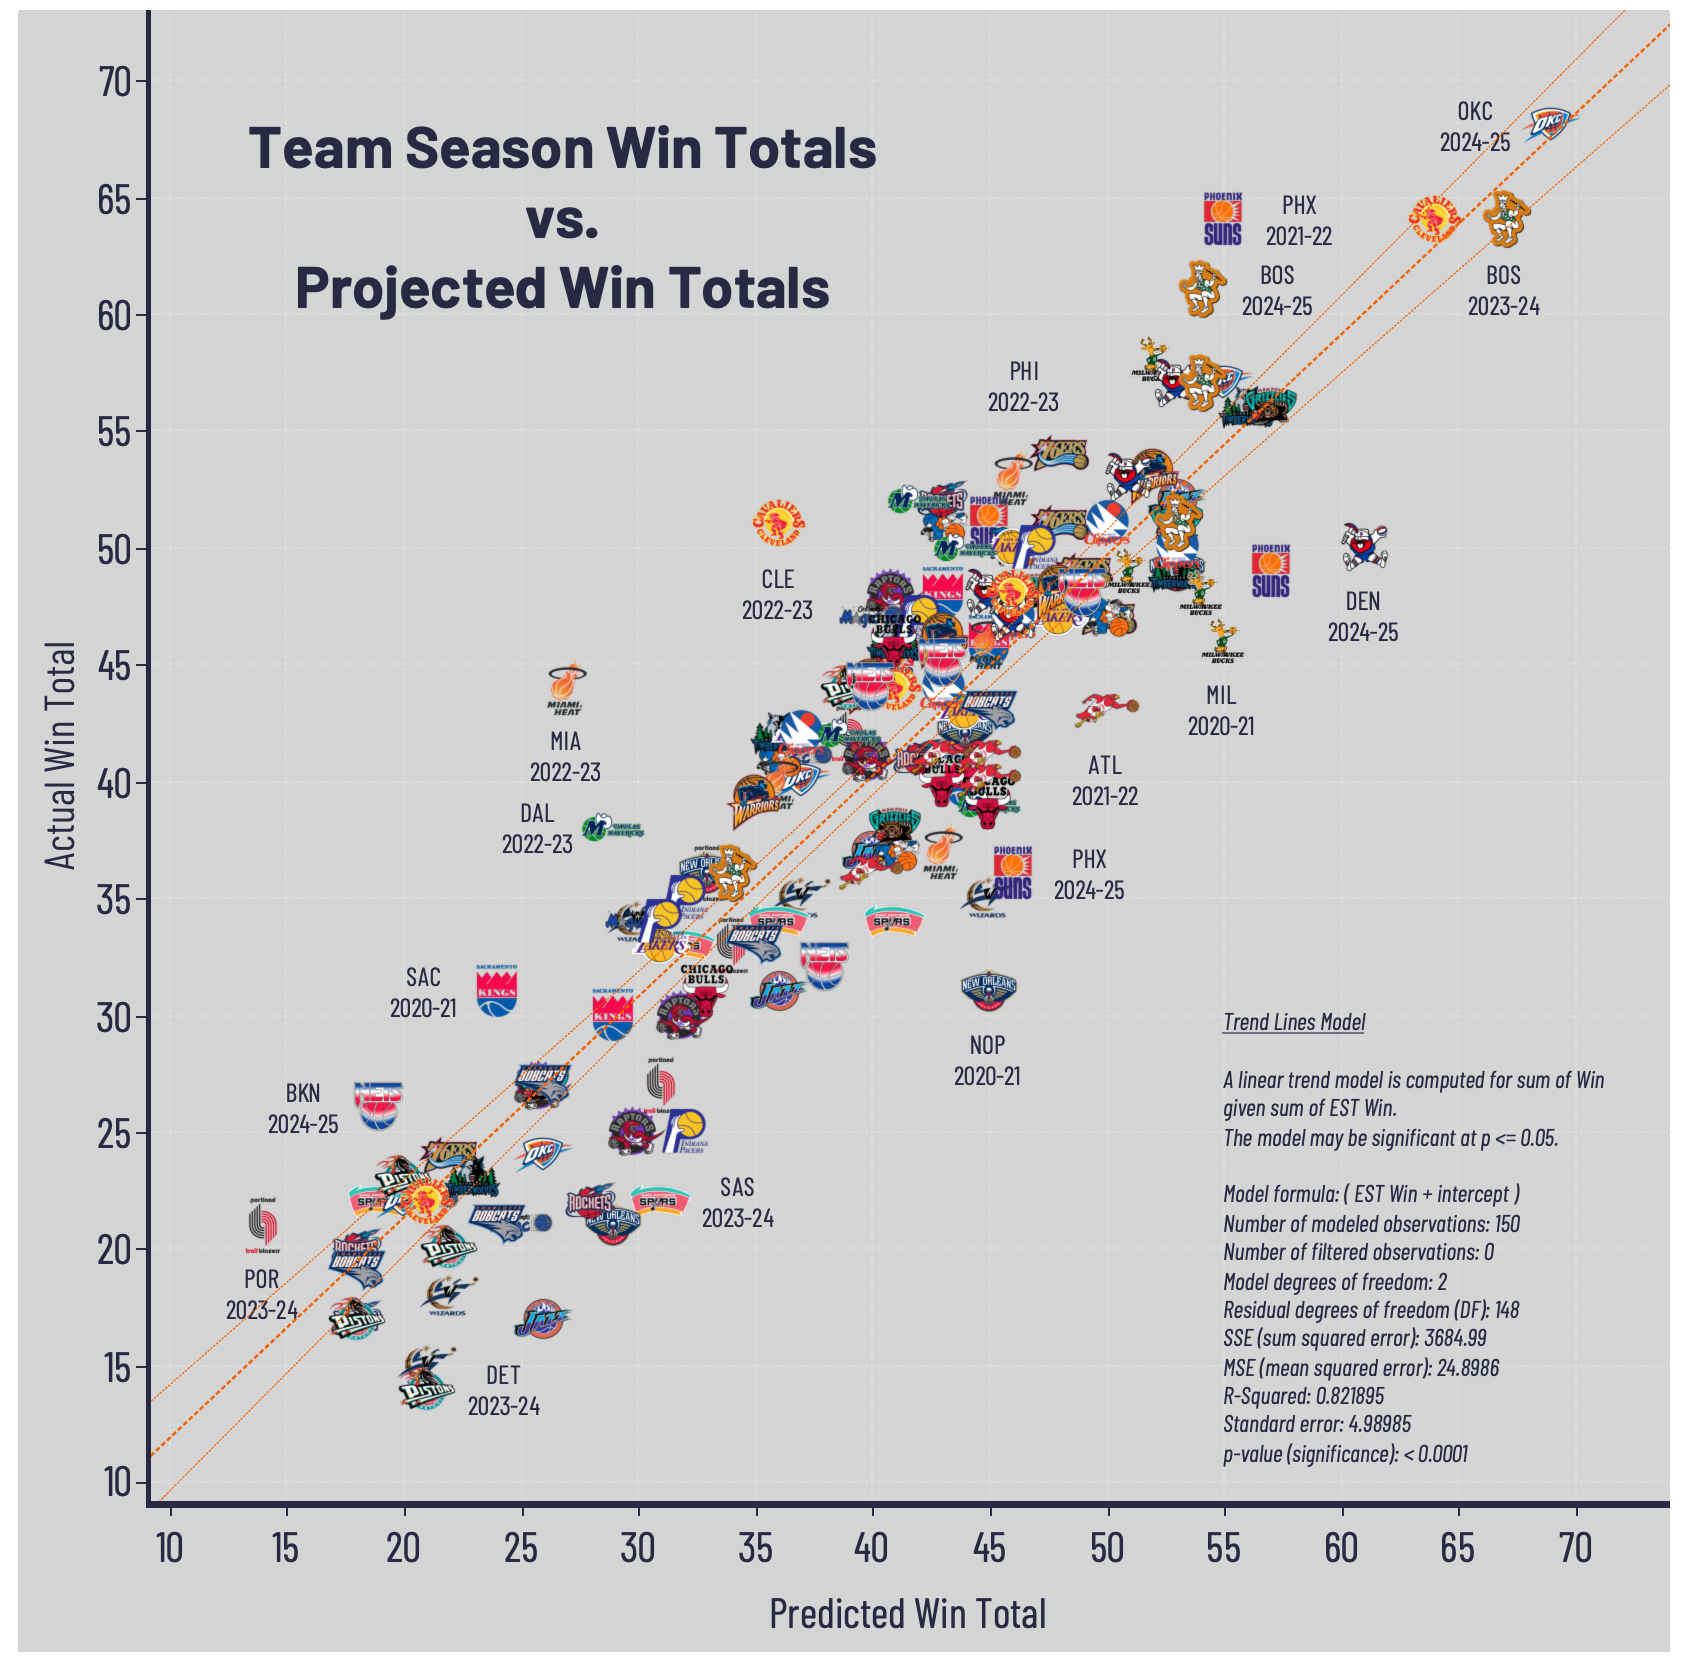
There are any number of ways to test the legitimacy and statistical significance of a regression. The quick and dirty way – if you happen not to have a background in econometrics – is to make a scatter plot with the two variables. If the model is accurate, the plot should follow a tight line because the variables should be highly correlated. If you have a scatter plot that truly scatters around in the plot, well, your model did not do an adequate job in projection.